Pressure-Enthalpy Diagrams for the Refrigeration Cycle
Learn how to read a pressure-enthalpy diagram, identify refrigerant states and relate the four processes to F-Gas assessment work.
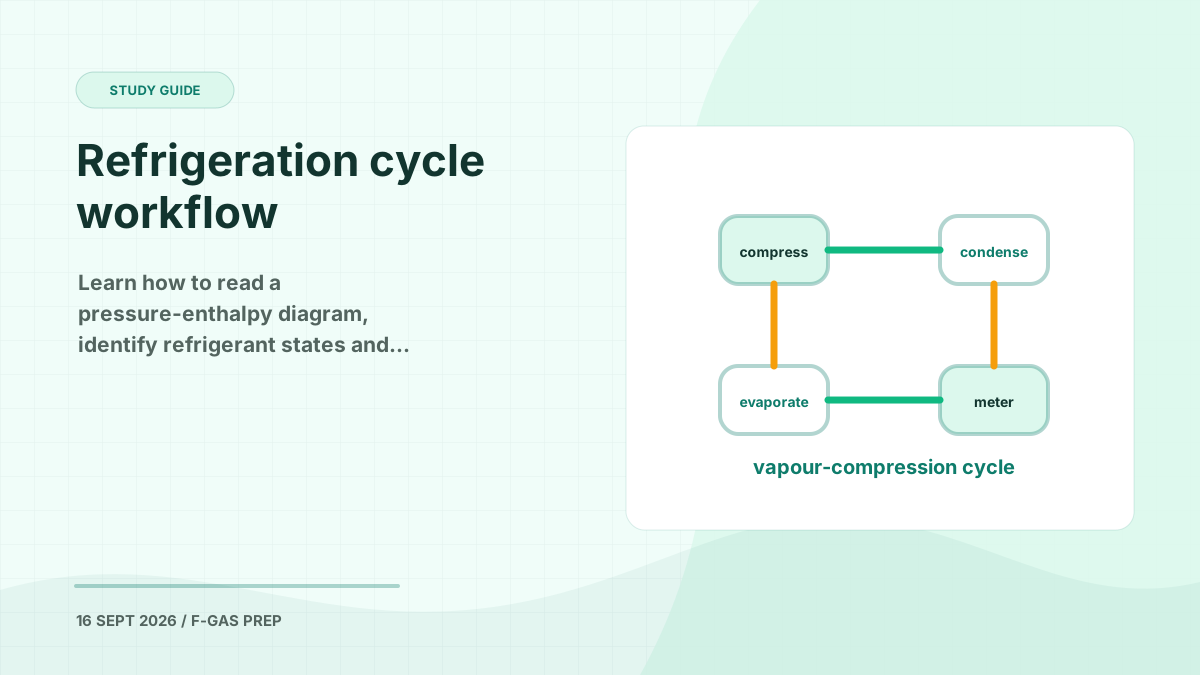
A pressure-enthalpy diagram can look intimidating at first, but it is one of the most useful tools for understanding what refrigerant is doing inside a vapour-compression system. Once you can recognise the principal regions and follow the four processes, the diagram turns pressures and temperatures into a clear picture of system operation.
This knowledge is directly relevant to the thermodynamics underpinning City & Guilds 2079 assessment work. It also supports practical skills involving compressors, condensers, evaporators, expansion devices, pressure measurement and system diagnosis.
“The refrigerant is the working fluid.”
That simple point is fundamental. Refrigerant circulates continuously, changing pressure, temperature, enthalpy and physical state as it absorbs and rejects heat.
The Four Main Components of the Refrigeration Cycle
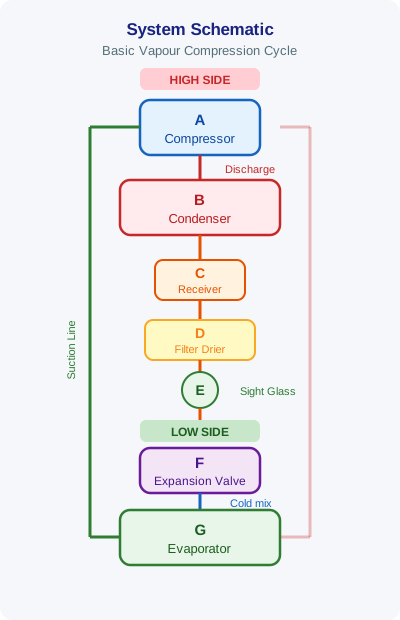
A basic vapour-compression refrigeration circuit contains four principal components:
- Compressor: draws in low-pressure vapour and compresses it into high-pressure, high-temperature vapour.
- Condenser: rejects heat and changes the refrigerant from vapour to liquid at high pressure.
- Expansion device: reduces the refrigerant pressure and controls flow into the evaporator.
- Evaporator: absorbs heat and changes the low-pressure refrigerant mixture into vapour.
The high side normally extends from the compressor discharge, through the condenser and liquid line, to the inlet of the expansion device. The low side begins after the expansion device and continues through the evaporator and suction line to the compressor inlet.
Refrigeration gauges conventionally use red for the high-pressure side and blue for the low-pressure side. These colours are useful identifiers, but an engineer must still verify that hoses are connected correctly and that the manifold and hoses are suitable for the refrigerant and operating pressure.
The compressor and expansion device establish the pressure difference that allows the cycle to work. High pressure does not automatically mean that every point on the high side has the same temperature, however. Refrigerant temperature changes considerably as vapour is desuperheated, condensed and subcooled.
Reading the Pressure-Enthalpy Diagram
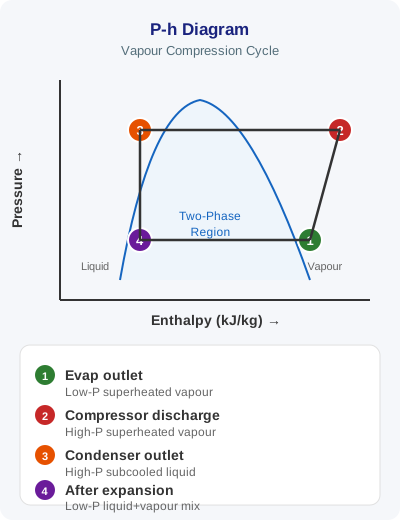
A pressure-enthalpy diagram, usually shortened to a p-h diagram, plots two primary properties:
- Pressure on the vertical axis, commonly using an absolute and logarithmic scale
- Specific enthalpy on the horizontal axis, normally expressed in kJ/kg
Enthalpy represents the refrigerant’s energy content per unit mass. The difference in enthalpy between two points is especially useful because it allows engineers to calculate evaporator capacity, condenser heat rejection and compressor work.
Every refrigerant has its own p-h diagram. An R410A diagram cannot be used for R134a, R32, ammonia or another refrigerant because each has different thermodynamic properties.
The most recognisable feature is the saturation dome. This divides the chart into three main regions:
- Subcooled or compressed liquid region: to the left of the dome
- Two-phase region: beneath the dome, containing liquid and vapour
- Superheated vapour region: to the right of the dome
The left boundary is the saturated liquid line. The right boundary is the saturated vapour line.
Saturated Liquid, Vapour Quality and Saturated Vapour
At the saturated liquid line, the refrigerant is liquid at the point where boiling is about to begin. This boundary is often called the bubble point, because adding energy produces the first bubble of vapour.
Inside the saturation dome, liquid and vapour coexist. The proportion of vapour is described as the refrigerant’s quality or dryness fraction:
- A quality of 0 means saturated liquid
- A quality of 0.5 means approximately 50% of the mass is vapour
- A quality of 1 means saturated vapour
Quality is only defined within the two-phase region. It should not be applied to subcooled liquid or superheated vapour.
At the saturated vapour line, the final liquid has just evaporated. When approaching from the vapour side during condensation, this boundary is called the dew point, because further cooling produces the first droplet of liquid.
“The state of the refrigerant depends on pressure and temperature.”
For a pure refrigerant at saturation, pressure fixes the saturation temperature. Many blended refrigerants have temperature glide, so their bubble-point and dew-point temperatures differ. R410A is a near-azeotropic blend and has only a small glide, but engineers must still use the correct manufacturer data when making precise measurements.
Understanding Subcooling
Subcooling occurs when liquid refrigerant is cooled below its saturation temperature at the measured condensing pressure. On a p-h diagram, subcooled liquid lies to the left of the saturated liquid line.
For example, if the saturation temperature corresponding to the liquid-line pressure is 40°C and the measured liquid-line temperature is 35°C:
Subcooling = 40°C − 35°C = 5 K
Adequate subcooling helps ensure that solid liquid reaches the expansion device. A lack of subcooling may indicate insufficient refrigerant, excessive pressure drop, poor condenser performance or flash gas in the liquid line. Readings must always be interpreted alongside airflow, load, ambient conditions and manufacturer specifications.
Understanding Superheat
Superheat is the amount by which vapour temperature exceeds the saturation temperature corresponding to its pressure. Superheated vapour appears to the right of the saturated vapour line.
If the evaporating saturation temperature is 5°C and the suction-line temperature is 11°C:
Superheat = 11°C − 5°C = 6 K
Superheat at the evaporator outlet confirms that evaporation has been completed. It also helps protect the compressor from liquid refrigerant. Excessive superheat can indicate evaporator starvation, restricted refrigerant flow, low charge or inadequate heat transfer. Very low superheat can suggest overfeeding or a risk of liquid returning to the compressor.
Gauge Pressure and Absolute Pressure
Service manifolds normally display gauge pressure, identified as PSIG or bar(g). Gauge pressure is measured relative to the surrounding atmosphere.
Thermodynamic diagrams generally require absolute pressure, identified as PSIA or bar(a). Absolute pressure is measured relative to a perfect vacuum.
The relationship is:
Absolute pressure = gauge pressure + local atmospheric pressure
At sea level, standard atmospheric pressure is approximately 14.7 psi or 1.013 bar. Therefore, a gauge reading of 100 PSIG corresponds to approximately 114.7 PSIA under standard sea-level conditions.
Atmospheric pressure changes with altitude and weather, so 14.7 psi is an approximation rather than a universal correction. Most importantly, never confuse gauge and absolute scales when plotting a system condition.
Following the Four Processes on the Diagram
The refrigeration cycle appears as four connected processes:
- Compression: low-pressure superheated vapour becomes high-pressure, high-temperature vapour. Pressure, temperature and enthalpy rise.
- Condensation: heat is rejected at high pressure. The refrigerant is desuperheated, condensed and potentially subcooled.
- Expansion: refrigerant passes through the metering device. Pressure falls sharply while enthalpy remains approximately constant.
- Evaporation: the low-pressure liquid-vapour mixture absorbs heat, boils and normally leaves as superheated vapour.
A real system will not follow perfectly ideal lines. Pressure losses, compressor inefficiency, heat transfer in pipework and changing load all affect the measured cycle.
F-Gas and City & Guilds 2079 Relevance
Under Regulation (EU) No 517/2014, Article 3 establishes duties to prevent emissions and repair detected leakage without undue delay. Article 4 sets leakage-check requirements according to the equipment’s tonnes of CO₂ equivalent, while Article 10 covers training and certification for personnel performing regulated activities.
Understanding refrigerant states supports these duties. It helps an engineer avoid liquid release, recover refrigerant correctly, identify abnormal operating conditions and distinguish possible charge problems from airflow or component faults.
Annex I lists fluorinated greenhouse gases and their global warming potentials. For blends such as R410A, the mixture GWP is calculated using the method in Annex IV and the component values. R410A has a commonly stated GWP of 2,088, making emission prevention and correct recovery particularly important.
For City & Guilds 2079 candidates, p-h diagram knowledge supports the thermodynamics skill group and practical assessment areas covering:
- Pressure and temperature relationships
- Refrigerant phase changes
- Safe use of manifold gauges
- Compressor, condenser and evaporator operation
- Expansion-device performance
- Superheat and subcooling
- Leak prevention, recovery and refrigerant handling
Candidates should also understand the different certification categories. Category I provides the broadest scope, while Categories II, III and IV restrict the activities a certificated person may undertake.
How F-Gas Exam Prep Fits Into This
F-Gas Exam Prep helps turn concepts such as saturation, enthalpy, superheat and subcooling into practical assessment knowledge. The app includes 370+ exam questions across all skill groups, so you can revise thermodynamics alongside legislation, leak checking, recovery and component-specific topics.
You can also use mock exams that mirror the real City & Guilds 2079 format, practise with AI voice challenges for interactive revision, and review detailed explanations for every answer. That combination helps you learn not only which answer is correct, but why it is correct—the level of understanding needed when interpreting a refrigeration system under assessment conditions.
Start Practising Today
Download the F-Gas Exam Prep app and study with 460+ practice questions, mock exams, and detailed explanations.