Drawing the Ideal Refrigeration Cycle on a Pressure-Enthalpy Chart
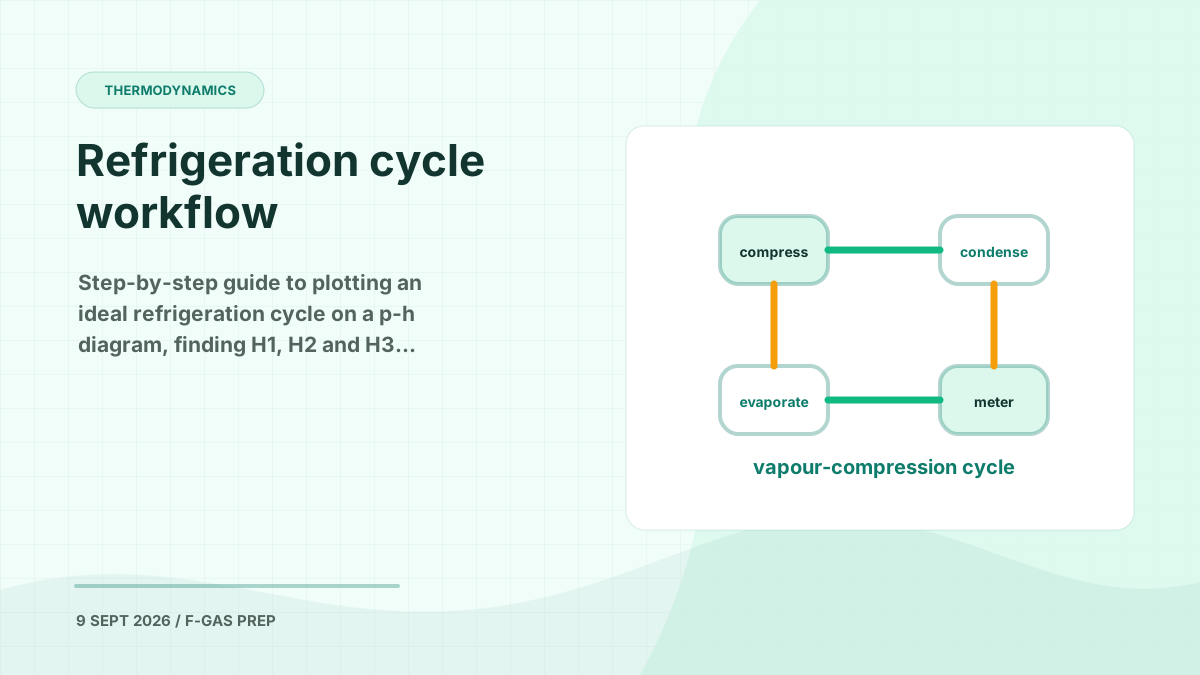
Step-by-step guide to plotting an ideal refrigeration cycle on a p-h diagram, finding H1, H2 and H3, and why it matters for the F-Gas exam.
If you have ever stood in a plant room staring at two gauges on a compressor pack and wondered how those two numbers relate to the whole system, the pressure-enthalpy chart is where the answer lives. This walkthrough is based on a teaching module by Professor R. Paul Singh, who shows how to construct an ideal vapour-compression cycle on a p-h diagram from nothing more than two pressures or two temperatures.
It is one of the most useful skills you can take into your F-Gas assessment, because almost every thermodynamics question on the City & Guilds 2079 paper is really a question about where a point sits on this chart.
Pressure and temperature: a fixed relationship
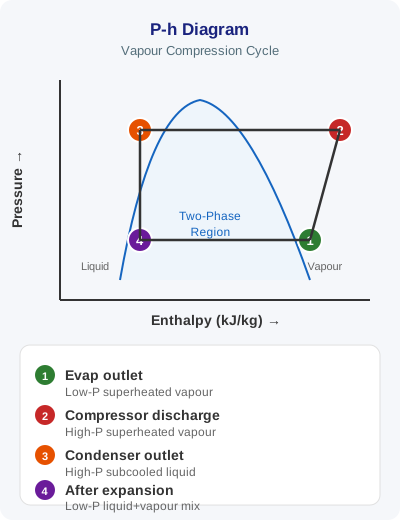
For any pure refrigerant, saturation pressure and saturation temperature are locked together. On the p-h chart, pressure runs up the left-hand axis in bar and enthalpy runs along the bottom in kJ/kg. Draw a horizontal line at any pressure and you will find the same saturation temperature printed where it crosses the saturated liquid curve on the left and the saturated vapour curve on the right.
“For any chemical substance, and we are of course looking at refrigerants, there is a very defined relationship between temperature and pressure.”
That fixed relationship is the reason a pressure-temperature comparator card works, and it is the reason your gauges can carry temperature scales for R410A or R134a printed alongside the pressure scale. This is exactly the knowledge listed under skill group 1 (basic thermodynamics) in Annex I of Regulation (EU) 2015/2067, the implementing regulation that sits beneath the F-Gas Regulation 517/2014 and defines what a Category I certificate holder must know.
Two pressures define the whole cycle
Walk into the plant room of any refrigerated warehouse and you will find two gauges on the compressor set. One reads the low side, which is the evaporator pressure. The other reads the high side, which is the condenser pressure. Every vapour-compression system, from a bottle cooler to a cold store, runs between these two levels.
“In any refrigeration system there are always two pressures. One is the low pressure and the other is the high pressure.”
Because of the pressure-temperature relationship, an exam question or a design brief can hand you the information in either form:
- Two pressures: suction pressure and discharge pressure, usually in bar absolute.
- Two temperatures: evaporating temperature and condensing temperature, in °C.
Either pair is enough. If you are given temperatures, you locate them on the saturation curves and read across. If you are given pressures, you draw the horizontal lines directly. The goal in almost every calculation is the same: find the three enthalpy values that describe the cycle, commonly labelled H1, H2 and H3.
Drawing the cycle step by step
Professor Singh uses an evaporating temperature of 10°C and a condensing temperature of 40°C as the worked example. Have a printed chart for your refrigerant to hand and follow these steps.
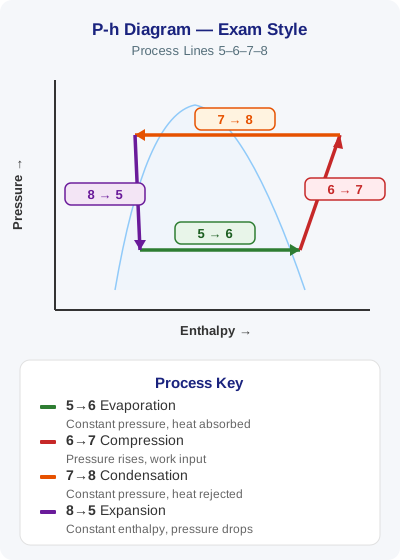
- Draw the evaporator line. Find 10°C on the saturated liquid curve and again on the saturated vapour curve. Join them with a horizontal line. This is the low-pressure side of the cycle, sitting under the bell-shaped dome.
- Draw the condenser line. Repeat the process at 40°C. This horizontal line sits higher up the chart and marks the high-pressure side.
- Follow a constant-entropy line for compression. Start where the evaporator line meets the saturated vapour curve on the right. From this point, trace along the constant-entropy curve, which slopes upward and outward to the right, until it reaches the condenser pressure line. You are now in the superheated region.
- Drop a vertical line for expansion. Go to the point where the condenser line meets the saturated liquid curve on the left. Draw a vertical line straight down until it reaches the evaporator pressure line. This is the expansion valve.
“It can be sometimes difficult to exactly follow a constant entropy curve, but do the best that you can, either to visually interpolate between the neighbouring constant entropy lines or, if the originating point happens to coincide with where a constant entropy line originates from the saturated vapour curve, you can essentially follow that line.”
The entropy lines are printed on the chart but they are spaced out, so your starting point will rarely land exactly on one. Interpolate by eye between the two nearest curves and keep your pencil parallel to them as you climb. A little practice with a real chart makes this second nature.
Reading the cycle: what each line means
Once the four lines are joined you have the closed loop of an ideal cycle. Label the corners E, A, B, C and D and each segment maps directly onto a component in the physical circuit.
| Segment | Component | Process |
|---|---|---|
| E to A | Evaporator | Refrigerant boils at constant low pressure, absorbing heat from the space |
| A to B | Compressor | Vapour compressed along a constant-entropy line into the superheated region |
| B to C | Condenser (desuperheating) | Superheat removed at constant high pressure until the vapour reaches saturation |
| C to D | Condenser (condensing) | Vapour condenses to saturated liquid at constant high pressure |
| D to E | Expansion valve | Pressure drops at constant enthalpy back to evaporator pressure |
Two points deserve extra attention because they come up repeatedly in assessments.
Point B is superheated. The compressor discharge always lies to the right of the saturated vapour curve. Before any condensing can happen, that superheat has to be rejected. Many textbooks lump B to D together as the total condenser duty, and that is perfectly acceptable for calculations, but you should know that the first part is desuperheating and only the second part is a true phase change.
Expansion is a vertical line. The drop from D to E is drawn at constant enthalpy. No heat is exchanged and no work is done as the liquid passes through the valve, so the enthalpy at E equals the enthalpy at D. The video describes this as an adiabatic process. Strictly, throttling through a valve is isenthalpic, and it is the constant-enthalpy assumption that gives you the vertical line on the chart. Either way, the practical outcome is the same: H at the valve inlet equals H at the valve outlet.
“The enthalpy at point D and point E is the same, so the expansion process is always drawn as a vertical line.”
Why the three enthalpy values matter
The whole point of constructing the cycle is to read off enthalpy values from the horizontal axis. With just three numbers you can calculate everything an engineer usually needs.
- Refrigerating effect is the enthalpy gained across the evaporator, from E to A. This is the useful cooling per kilogram of refrigerant circulated.
- Compressor work is the enthalpy rise from A to B. This is the energy you pay for.
- Condenser heat rejection is the enthalpy drop from B to D, which must equal the sum of the other two.
- Coefficient of performance is the refrigerating effect divided by the compressor work.
Notice how the chart makes the design trade-offs visible. Raise the condensing temperature and the top line moves up, the compression line gets longer and the vertical expansion line shifts right, shrinking the refrigerating effect. Lower the evaporating temperature and the bottom line drops, stretching the compression line again. This is precisely why a dirty condenser or an iced evaporator costs so much in running energy, and why the F-Gas Regulation places such emphasis on leak checking and maintaining systems at their design charge.
What the F-Gas exam expects
The City & Guilds 2079 Category I assessment is built around the competencies listed in Annex I of Regulation (EU) 2015/2067. The theoretical paper draws heavily on skill group 1, basic thermodynamics, which requires candidates to:
- Know the basic ISO units for temperature, pressure, mass, density and energy.
- Understand the pressure-temperature relationship of refrigerants and how it is used to check superheat and subcooling.
- Use tables and diagrams, including the p-h chart, to interpret the state of the refrigerant at each point in the cycle.
- Describe the function of the four main components: compressor, condenser, expansion device and evaporator.
Typical exam questions will show you a p-h diagram and ask which process a labelled line represents, or ask where superheated vapour, saturated liquid and two-phase mixture sit relative to the dome. You may also be asked what happens to the cycle if condensing pressure rises or which line is drawn at constant entropy.
Exam tip: Remember the shapes. Horizontal lines are constant pressure (evaporator and condenser). The sloping line to the upper right is constant entropy (compressor). The vertical line is constant enthalpy (expansion valve). If you can picture those four lines you can answer most cycle questions without any numbers at all.
Key point: Point B, the compressor discharge, is always in the superheated region. Point D, the condenser outlet, is on or just left of the saturated liquid curve. Point E, after expansion, is inside the dome as a liquid-vapour mixture.
How F-Gas Exam Prep Fits Into This
Understanding the p-h chart in a lecture is one thing. Being able to answer a multiple-choice question about it under time pressure, alongside questions on Regulation 517/2014 leak-check intervals and recovery procedures, is another. That is where structured practice pays off.
The F-Gas Exam Prep app covers this material with 370+ exam questions across all skill groups, including a dedicated thermodynamics section that tests the pressure-temperature relationship, cycle processes and reading refrigerant states from diagrams. Every answer comes with a detailed explanation, so when you pick the wrong line for compression you learn why the constant-entropy curve is the correct one rather than simply moving on.
Mock exams mirror the real City & Guilds 2079 format, so you build a feel for the timing and the way questions are phrased. For revision on the move, the AI voice challenges let you talk through concepts such as “why is expansion drawn as a vertical line?” and get instant feedback, which is a surprisingly effective way to make the chart stick.
Get comfortable drawing the ideal cycle from two temperatures, learn what each corner means, and the thermodynamics section of your F-Gas assessment will feel far less daunting.
Start Practising Today
Download the F-Gas Exam Prep app and study with 460+ practice questions, mock exams, and detailed explanations.